Optimization paralysis—we've all been there. Five promising systems, but which one do you actually trade? What if the answer is: all of them?
When developing trading systems, you'll often face a common dilemma. After running optimizations or combining different filters, you don't end up with just one ideal system. Instead, you're left staring at 4, 8, 12, or even 16 different variations that all look promising. Traditionally, traders would analyze these candidates, select the "best" one, and discard the rest.
But what if there's a better approach?
In this article, I'll introduce you to a concept I call "Swarm Mode." In technical terms, this is a form of ensemble trading, similar to the machine learning technique known as Bagging (Bootstrap Aggregating). But "Swarm Mode" just sounds better, doesn't it?
The core idea is simple yet powerful: instead of selecting a single system, we'll deploy multiple variations of a core strategy simultaneously, using micro contracts to manage our overall risk exposure. This approach provides instant diversification within a single trading concept and can potentially lead to more robust performance across varying market conditions.
Let's dive in and see how this works in practice using Build Alpha and Larry Connors' popular Two-Period RSI strategy as our foundation.
The Foundation: Larry Connors' Two-Period RSI Strategy
Larry Connors' Two-Period RSI strategy has stood the test of time as a reliable mean-reversion approach for stock index markets, particularly the S&P 500. Its enduring popularity stems from its simplicity and effectiveness, making it an ideal candidate to demonstrate our Swarm Mode concept.
The basic premise of this strategy is straightforward:
- Buy when the two-period RSI falls below 30 (indicating an oversold condition)
- Sell when the two-period RSI rises above 70 (indicating an overbought condition)
To implement this strategy using Build Alpha, we'll start by coding the core rules. If you're not familiar with Build Alpha, it's a powerful system development platform that allows you to quickly test and optimize trading ideas without writing code. You can learn more about Build Alpha by checking out this article, The No-Code Solution for Generating Winning Trading Systems.
For our implementation, we'll configure Build Alpha with these initial parameters:
- Market: ES (E-mini S&P 500 futures)
- Direction: Long only
- Entry condition: Two-period RSI < 30
- Exit conditions:
- Two-period RSI > 70, or
- Maximum hold time reached (starting with 3 days, and also testing 4 and 5 days)
- Stop loss: Testing ATR-based stops of 4X, 6X, and 8X
- Testing period: 2006-2022 (in-sample), with 2023-2025 reserved for out-of-sample validation
- Commission $2.50 per trade
- Slippage $12.50 per trade
The 2006 starting date was chosen specifically because it marks the beginning of the fully electronic futures market era, giving us a consistent data environment.
For execution settings, we'll enter on the next bar's open, apply realistic slippage and commission values, and limit our strategy to two rules per entry—keeping things elegantly simple.
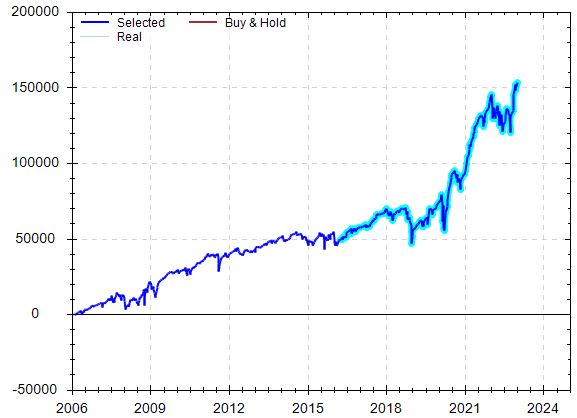
When we run this basic setup through Build Alpha, it quickly generates a set of variations based on our parameters. The system checks that we have valid prices, applies our two-period RSI < 30 entry condition, and tests our various exit combinations.Below is a typical equity curve:

Highlighted blue line is out-of-sample.
This foundational strategy produces a reasonably good equity curve, but what if we could enhance it further? That's where the next step in our process comes in.
Enhancing the Base Strategy
Now that we have our foundational strategy in place, we can explore how to enhance it using Build Alpha's powerful optimization capabilities. This is where our journey toward Swarm Mode truly begins.
Rather than just fine-tuning parameters of the base strategy, we'll take a more sophisticated approach by looking for complementary filters that can improve our strategy's performance. To accomplish this, I'll leverage Build Alpha's extensive library of technical indicators.
In Build Alpha, I'll select nearly 4,000 different indicators from the legacy single signals menu. This gives the system a vast array of potential filters to test in combination with our two-period RSI entry condition. The goal is to find additional conditions that, when combined with our core RSI signal, produce superior results.
For this initial optimization, I'll use the fitness function of "net profit versus drawdown"—a balanced metric that rewards both profitability and risk management. I'll configure the testing to ensure:
- 40% of data is reserved for out-of-sample validation
- A minimum of 50 trades in both in-sample and out-of-sample periods
When we run this optimization, Build Alpha quickly tests thousands of combinations and identifies several promising filters. Let's examine what it found:

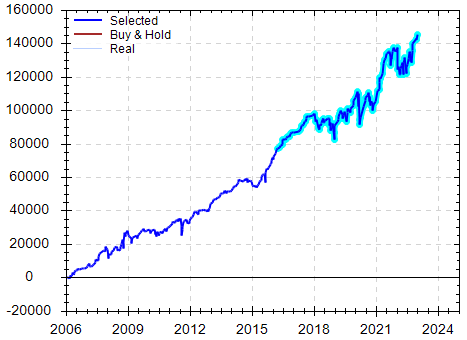
At the top of our results list is a system that combines our two-period RSI < 30 signal with a price action filter. Specifically, it requires that the open from three bars ago is less than or equal to the low from five bars ago. This particular combination generates an impressive equity curve with excellent in-sample and out-of-sample performance.

Scrolling through the results, we find several variations with similar entry conditions but different stop loss values. Some use tighter stops while others employ wider ones, all producing slightly different performance metrics.
Further down, we discover another cluster of promising systems. These use a "value high" indicator as part of the filter, generating distinctly different equity curves that also show promising performance.

Continuing our exploration, we find systems using Kaufman Efficiency Ratio as a filter, each with its own performance characteristics and equity curve patterns.

And herein lies our dilemma—which system should we actually trade?
Traditionally, traders would analyze these results, select what appears to be the most robust system, and begin trading it. In this case the very 1st equity curve with the price filter looks the beset. But this approach discards valuable information and alternative systems that might perform better in future market conditions. In short, how do we know which version will work best moving forward?
We don't know! This is precisely where our Swarm Mode concept offers a compelling alternative.
The Swarm Mode Concept
The advent of micro contracts in futures trading has created a fascinating opportunity to rethink our approach to system deployment. Traditional futures contracts, even E-mini contracts, often require significant capital allocation for each trade. But micro contracts, at one-tenth the size of an E-mini, allow for more granular position sizing and risk management.
This is where the Swarm Mode concept becomes truly powerful.
Instead of choosing a single system from our optimization results, what if we traded multiple systems simultaneously? Here's the core idea: Rather than allocating our capital to a single approach, we can spread it across several variations of our base strategy.
For example, let's say we were planning to trade one E-mini S&P 500 contract with our two-period RSI strategy. With micro contracts, we could instead trade ten different variations of that strategy, each trading a single micro contract. The total position size remains equivalent to one E-mini contract, but our approach is now diversified across multiple system variations.
Why is this beneficial? Because we simply don't know with certainty which system variation will perform best in future market conditions.
Even the most promising backtest results can falter in live trading due to luck, changing market regimes, or other unforeseen factors. By trading a "swarm" of systems, we're acknowledging this uncertainty and creating instant diversification within our core trading concept.
This approach embodies the statistical principle that a collection of diverse models often outperforms any single model—the same principle that powers ensemble methods in machine learning and statistics.
To implement Swarm Mode effectively, we want to select systems that:
- Share the same core concept (in our case, the two-period RSI)
- Employ meaningfully different secondary filters
- Use varying parameter settings (like different stop losses or hold times)
- Demonstrate solid performance individually
- Ideally, enter and exit the market at somewhat different times
The goal isn't to simply pick the top five systems from our optimization results. Instead, we want to create a diverse portfolio of approaches to the same trading concept. This diversity is what gives our swarm its robustness.
In the next section, we'll walk through the process of selecting five distinct systems from our optimization results and combining them into a Swarm Mode portfolio.
I'll make that correction. Let me update this part of the section:
Creating a Swarm Portfolio
With our concept in place, let's now create an actual Swarm Mode portfolio using our optimization results. The goal is to select five distinct systems that all leverage the two-period RSI concept but approach it in different ways.
Selecting Diverse Systems
Let's start with our top performer, which combines the two-period RSI with a specific price action filter (where the open from three bars ago is less than or equal to the low from five bars ago). This system produced an excellent equity curve with strong metrics, so it's a natural first choice for our swarm.

RSI-Swarm, Sub-System 1
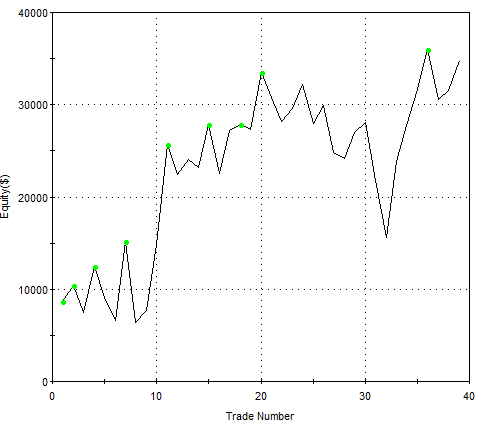
For our second selection, I'll choose another price-based system, but one with a different filter. This system uses a condition where the high from three bars ago is less than or equal to the close from eight bars ago, combined with our two-period RSI signal. While similar in concept to our first selection, it uses different price points and lookback periods, creating distinction in its entry signals.

RSI-Swarm, Sub-System 2
Moving further down our results list, I notice a cluster of systems using the "value high" indicator. This represents a fundamentally different approach from our price action filters, so I'll select the best performer from this group as our third system.

RSI-Swarm, Sub-System 3
For our fourth system, I'll change the fitness function in Build Alpha from "net profit versus drawdown" to simply "net profit." This gives us a different perspective and brings a Value Close indicator to the top of our new results. This indicator is distinct from the value high in our third system, adding more diversity to our portfolio.

RSI-Swarm, Sub-System 4
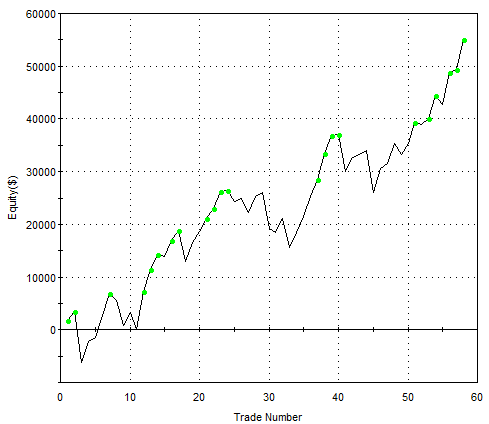
Finally, for our fifth system, I find an entirely different indicator - the Kaufman Efficiency Ratio (KER) - which, when combined with our two-period RSI entry condition, produces a solid equity curve with unique characteristics compared to our other selections.

RSI-Swarm, Sub-System 5
Now we have five distinct systems, each sharing the core two-period RSI concept but implementing it with different complementary filters:
- Price action filter (open 3 bars ago ≤ low 5 bars ago)
- Price action filter (high 3 bars ago ≤ close 8 bars ago)
- Value high indicator
- Value close indicator
- Kaufman Efficiency Ratio
Each system also has its own unique combination of stop loss values and maximum hold times, further diversifying our approach.
Combining Systems into a Swarm
After selecting and validating our five individual systems, the next critical step is to analyze how they perform together as a swarm of systems. This analysis answers the key question: Does the Swarm Mode approach actually deliver better results than any single system?
To find out, I first loaded each of our five systems into a chart and traded a single contract for each strategy. I moved the historical data to the out of sample data segment, February 28, 2025 with three years of historical data. The results are in the table below. Each system result represents a possible outcome we might have faced if we traded on a single strategy. Naturally, they are all different, and our dilemma in building systems is we don't know for sure which one will work going forward.
System 1 | System 2 | System 3 | System 4 | System 5 | |
|---|---|---|---|---|---|
Net Profit | $59,663 | $34,755 | $86,807 | $89,613 | $55,048 |
Profit Factor | 3.70 | 1.57 | 2.11 | 2.04 | 1.89 |
Total Trades | 30 | 39 | 76 | 80 | 58 |
Avg.Trade Net Profit | $1,989 | $892 | $1,143 | $1,120 | $949 |
Max Drawdown | $13,943 | $24,068 | $24,070 | $24,973 | $19,718 |
NP vs. DD | 4.3 | 1.4 | 3.6 | 3.6 | 2.8 |
Next, I loaded all five strategies into Portfolio Analyst, my preferred portfolio analysis tool. This tool allows us to see the combined performance as if we were trading all five systems simultaneously, with each system allocated two micro contracts.
The portfolio results are impressive: Trading all five strategies together generated $68,865 in profit over our three-year out-of-sample period. Remember, this is exclusively using data that was not part of our original optimization—true unseen data that provides a realistic picture of how these systems might perform in live trading.
System 1 | System 2 | System 3 | System 4 | System 5 | Swarm | |
|---|---|---|---|---|---|---|
Net Profit | $59,663 | $34,755 | $86,807 | $89,613 | $55,048 | $65,117 |
Profit Factor | 3.70 | 1.57 | 2.11 | 2.04 | 1.89 | 2.05 |
Total Trades | 30 | 39 | 76 | 80 | 58 | 283 |
Avg.Trade Net Profit | $1,989 | $892 | $1,143 | $1,120 | $949 | $230 |
Max Drawdown | $13,943 | $24,068 | $24,070 | $24,973 | $19,718 | $12,773 |
NP vs. DD | 4.3 | 1.4 | 3.6 | 3.6 | 2.8 | 5.1 |
Looking at the detailed performance metrics, we can see the Combined strategy make about average profit compared to the other five. The real benefit comes in the drawdown. The strategies worked together in such a way we have an improve risk adjusted return. Namely, the NPDD is 5.1 which is the best in the bunch.
The recommend account size is $65,400. Below are image of the equity curve, drawdown and periodic returns table.


It's important to note that future drawdowns are typically larger than what we see in backtests, so prudent risk management remains essential. However, the diversification effect of trading five distinct systems helps mitigate this risk compared to trading any single system with the same total position size.

The periodic returns analysis further confirms the consistency of this approach, showing positive returns across most time periods.
This portfolio analysis demonstrates the core benefit of the Swarm Mode approach: By combining multiple variations of our core strategy, we create a more robust trading system that maintains the profit potential while potentially reducing overall risk through diversification.
Conclusion and Key Takeaways
The Swarm Mode approach to system trading represents a powerful technique in how we can deploy trading strategies in today's markets. By leveraging the flexibility of micro contracts, we can transform the common dilemma of "which system should I trade?" into a strategic advantage.
Swarm Mode isn’t about creating a diversified portfolio—it’s a way to increase the robustness of an individual strategy before including it in a portfolio. The core idea: Instead of picking one version of a strategy and hoping it survives, trade a swarm of variations.
This isn’t an alternative to a diversified portfolio—it's a way to make a single strategy more robust before it’s even added to a portfolio.
Standard Portfolio → 5 diversified strategies, each trading 1 mini contract.
Swarm Mode → Each of those 5 strategies now trading 5 sub-systems, each with 2 micro contracts.
As we've demonstrated with our two-period RSI example, creating a swarm of related but distinct trading systems offers several compelling benefits:
- Enhanced Robustness: By diversifying across multiple variations of our core strategy, we're less vulnerable to the failure of any single approach.
- Smoother Equity Curve: The portfolio effect tends to smooth out the equity curve, as different systems often experience drawdowns at different times.
- Improved Risk Adjusted Returns: Reduced drawdown.
- Reduced Optimization Anxiety: Rather than agonizing over which single system is "best," we can select a diverse set of promising candidates.
It's worth noting that what I'm calling "Swarm Mode" is essentially a form of ensemble trading, similar to the machine learning technique known as Bagging (Bootstrap Aggregating). These ensemble methods are well-established in quantitative fields for their ability to produce more robust results than single models.
Depending on how you trade these strategies, if you were to take them live in TradeStation, you need to update the code a bit so each strategy will act on its own unique signals. I didn't want to get into those technical weeds in this article, but it's an important implementation detail to keep in mind.
As you consider applying this approach to your own trading, remember that the key to a successful swarm isn't just selecting your top-performing systems. Instead, focus on creating meaningful diversity within your core trading concept. Look for systems that use different indicators, different parameter values, and ideally enter and exit the market at somewhat different times.
The advent of micro contracts has made this approach accessible to traders with modest account sizes. Even if you were planning to trade just one mini contract, you can now trade five diverse systems with two micro contracts each – potentially improving your results while maintaining equivalent overall exposure.
I encourage you to experiment with this approach in your own system development. Whether you're using Build Alpha or another development platform, the Swarm Mode concept can help you transform the optimization dilemma into a strategic advantage.
Video Demo!
Watch me demonstrate the Swam Mode using Build Alpha and TradeStation by watching this video:
Resources
- Build Alpha - Strategy development platform used in this article
- The No-Code Solution for Generating Winning Trading Systems - Article/video on using Build Alpha
- Alpha Compass - My comprehensive course on using Build Alpha
- YouTube Demonstration - Step-by-step video showing the RSI2 Swarm Mode implementation
- Portfolio Analyst - The portfolio analysis tool mentioned in the article
- Walk Forward Analysis For Algo Traders - My course on how to validate trading systems using Portfolio Analyst.


Great article, Jeff. While many traders tend to focus on just one or a few markets, your ‘Swarm Trading’ approach offers a diversified strategy that reaps the benefits of broader market exposure. I also appreciate how you showed that it’s possible to retain the essence of your original strategy while incorporating varied entry and exit levels—each iteration complementing the others for improved results. Additionally, it’s crucial to recognize that building robust trading strategies is a collaborative effort—no single piece of software can do it all.
Thanks for the comment—I’m glad you liked it! That’s a great point about the number of tools involved. In this demo alone, we’re using EasyLanguage, TradeStation, Build Alpha, and Portfolio Analyst. I hadn’t even considered it from that perspective before.